
Machine Learning Development Life Cycle: A Complete Guide
📚 Table of Contents
Introduction
The Machine Learning Development Life Cycle (MLDLC) is essential for anyone who wants to build machine learning projects from start to finish. While understanding “why” and “what” machine learning is matters, knowing “how” to actually build ML projects is even more important. This guide serves as a roadmap for creating complete, end-to-end machine learning products.
Background of the Topic
Understanding Software Development Life Cycle (SDLC)
If you’ve studied computer science, you’ve probably heard about Software Engineering. One of the most important topics in this field is the Software Development Life Cycle (SDLC).
What is SDLC? It’s a set of guidelines that software developers follow when building software products. SDLC covers the entire process from the very beginning to the end, ensuring a structured approach to software creation.
From SDLC to MLDLC
As more companies started building machine learning-based products, researchers realized they needed similar guidelines specifically for ML projects. This led to the creation of the Machine Learning Development Life Cycle (MLDLC).
MLDLC Definition: A set of guidelines you must follow when building any machine learning-based software product. It provides a complete process from your initial idea all the way to the final product.
A Common Mistake
Many students and professionals focus only on training a model and achieving good accuracy, then stop. However, companies look for candidates who can build end-to-end products. To create complete products, you need to understand all nine steps of the MLDLC.
# Common mistake - stopping after training
from sklearn.linear_model import LogisticRegression

model = LogisticRegression()
model.fit(X_train, y_train)
accuracy = model.score(X_test, y_test)
print(f"Accuracy: {accuracy}")
# ❌ Stopping here is not enough for real-world projects!
Framing the Problem
This is the first and most crucial step in the MLDLC. Before building anything, you need to clearly define what you’re trying to achieve.
Why This Step Matters
Unlike school projects, in a company setting you work for clients or customers. Resources like money and time are involved. You cannot simply start, realize a mistake halfway through, and restart. Every wrong decision costs the company money and wastes valuable time.
Imagine building a house without a blueprint. You might end up with rooms in the wrong places, doors that don’t fit, or a kitchen without proper ventilation. The same principle applies to machine learning projects. Without proper planning, you’ll waste resources and might build something that doesn’t solve the actual problem.
Key Questions to Answer
At this stage, you must “frame the problem” by answering these critical questions:
- What exactly is the problem? What do you need to solve? Be specific. “Improve customer satisfaction” is too vague. “Predict which customers will cancel their subscription in the next 30 days” is specific.
- Who are your customers? Who will use this product? A bank manager needs different features than a regular customer.
- What is the budget? How much will this project cost? This determines what technologies you can use and how many people you can hire.
- What kind of team is needed? How many people and what skills are required? Do you need data scientists, machine learning engineers, or software developers?
- What will the final product look like? Will it be a website, mobile app, or dashboard? How will users interact with it?
- What type of machine learning? Will it be supervised learning (with labeled data) or unsupervised learning (finding patterns without labels)?
- How will the model run? In batch mode (processing data in chunks, like analyzing yesterday’s sales every morning) or online mode (real-time processing, like fraud detection on every transaction)?
- What algorithms should be used? Which algorithms are best suited for this problem? Linear regression for simple predictions or deep learning for complex patterns?
- Where will the data come from? What are the data sources? Customer databases, website clicks, sensor readings?
The Value of Clear Planning
By answering these questions thoroughly at the beginning, you gain a clear mental picture of what needs to be done next. This prevents costly mistakes and ensures everyone on the team understands the goal.
Think of it like planning a vacation. You need to know your destination, budget, travel dates, and who’s coming before you book flights. Similarly, framing the problem gives you direction for the entire project.
Gathering the Data
Machine learning is impossible without data. This second step focuses on obtaining the necessary data for your project.
Why Data Collection Is Critical
Your machine learning model is only as good as the data you feed it. Imagine trying to teach someone to recognize cats, but you only show them pictures of dogs. No matter how smart they are, they’ll never learn to identify cats correctly. The same applies to machine learning models.
Difference from Academic Projects
In school, data is often readily available from sources like Kaggle. You download a CSV file and start working. However, in companies, data is usually very specific and not easily accessible. You might need customer purchase history, website behavior, sensor readings, or social media interactions – none of which are available in ready-made datasets.
Various Data Sources and Methods
Direct CSV Files
Sometimes, you receive data directly in CSV files. This is the easiest scenario but least common in real-world projects.
APIs (Application Programming Interfaces)
Often, you need to pull data from an API. Think of an API as a waiter in a restaurant. You (your code) ask the waiter (API) for something specific, and the waiter brings it from the kitchen (database). You write Python code that requests data from the API, which then returns it, usually in JSON format.
import requests
import pandas as pd

# Simple example of getting data from an API
response = requests.get("https://api.example.com/customer-data")
data = response.json()
df = pd.DataFrame(data)
Web Scraping
If data is publicly available on websites but not downloadable, you perform web scraping. For example, travel websites like Goibibo scrape hotel details from various hotel websites. E-commerce sites show product prices from different vendors by scraping their websites. You write code that automatically visits web pages and extracts the information you need.
Databases and Data Warehouses
Your data might reside in a database. However, you don’t run machine learning directly on operational databases because any error could crash the website or slow down customer transactions. Instead, you create a separate data warehouse.
The ETL Process (Extract, Transform, Load) moves data safely:
- Extract data from operational databases
- Transform it (clean, reformat, combine)
- Load it into the data warehouse
- Perform ML tasks on this separate warehouse without affecting live operations
Big Data Tools
If your data is massive (think billions of records), it might be stored in tools like Hadoop or HDFS (Hadoop Distributed File System). These systems distribute data across multiple computers, making it possible to work with datasets too large for a single machine.
The Core Idea
The main objective isn’t just gathering data but also storing it in the correct format so you can work with it effectively in subsequent stages. Think of it as collecting ingredients for a recipe – you need the right ingredients in the right amounts, properly stored and organized.
Data Pre-Processing
Raw data is rarely clean and ready for machine learning. This step prepares your data for analysis.
Why Pre-Processing Is Essential
Imagine trying to bake a cake with ingredients still in their packaging, some spoiled, and measurements in different units (cups, grams, liters). You’d need to clean, measure, and prepare everything first. Similarly, raw data from various sources is often “dirty” and cannot be directly used for machine learning.
Important: Dirty data leads to inaccurate models. There’s a saying in machine learning: “Garbage In, Garbage Out.” If you feed your model bad data, it will make bad predictions, no matter how sophisticated your algorithm is.
Common Data Problems
Duplicates: Imagine a customer database where the same person appears three times because they signed up multiple times with slightly different email addresses. These repeated entries can make your model think this person is three different people.
Missing Data: Empty values or gaps in the data. For example, some customers didn’t provide their age, or some sales records are missing price information. Your model can’t work with blank spaces.
Outliers: Data points significantly different from others. If most houses in your dataset cost $200,000-$400,000, but one mansion costs $50 million, this outlier can skew your model’s predictions.
Mismatched Data: Data from different sources might not be compatible. One database stores dates as “DD/MM/YYYY” while another uses “MM-DD-YYYY.” One measures temperature in Celsius, another in Fahrenheit.
Common Pre-Processing Tasks
Removing Duplicates: Find and eliminate redundant rows to ensure each data point is unique.
Handling Missing Values: You have several options:
- Fill missing numbers with the average (mean) of that column
- Fill missing categories with the most common value (mode)
- Remove rows with too many missing values
- Use advanced techniques to predict missing values
Removing Errors: Correct data entry mistakes, like ages listed as 200 years or prices as negative numbers.
Scaling Values: This is crucial when your columns have vastly different ranges. For example, one column might represent age (0-100), another represents income (0-1,000,000), and another represents number of purchases (0-50).
Machine learning algorithms, especially those calculating distances (like K-Nearest Neighbors), can get confused by these different scales. They might think income is more important just because the numbers are bigger. Scaling brings all values to a similar range (like 0 to 1), ensuring fair treatment of all features.
from sklearn.preprocessing import StandardScaler

# Simple example of scaling
scaler = StandardScaler()
scaled_data = scaler.fit_transform(data)
The Core Idea
Transform your raw data into a clean, consistent format that your machine learning algorithm can easily process. This step is like preparing ingredients before cooking – washing vegetables, measuring flour, and arranging everything neatly.
Exploratory Data Analysis (EDA)
EDA is where you analyze your data to understand its characteristics and discover relationships. This is one of the most important steps that many beginners skip.
Why EDA Matters
Before building a prediction model, you need to know your data intimately. Imagine a doctor prescribing medicine without examining the patient or looking at test results. That would be dangerous and irresponsible. Similarly, building a machine learning model without understanding your data leads to poor results.
EDA helps you:
- Understand what’s actually in your data
- Discover hidden patterns and relationships
- Identify problems you need to fix
- Make informed decisions about which features to use
- Determine which algorithms might work best
The Experimentation Process
EDA involves extensive experimentation with your data. You create visualizations, calculate statistics, and explore relationships between different variables. It’s like being a detective, looking for clues in your data.
Common EDA Techniques
Visualization
Plotting graphs helps you see patterns that numbers alone can’t reveal.
- Histograms show how data is distributed
- Scatter plots reveal relationships between two variables
- Box plots identify outliers
Univariate Analysis
Analyzing each column independently. For example, looking at the age column: What’s the average age? What’s the most common age? What’s the age range? This gives you a deep understanding of individual variables.
Bivariate Analysis
Analyzing relationships between two columns. For example, does age relate to income? Do customers who buy more frequently also spend more money? Plotting two variables against each other reveals correlations and patterns.
Multivariate Analysis
Analyzing relationships between three or more columns simultaneously. This reveals complex interactions that you might miss when looking at variables individually.
Outlier Detection
Finding unusual data points that could skew your model. For instance, if most customers spend $10-$100, but one customer spent $1,000,000, you need to investigate whether this is real or an error.
Imbalanced Data Handling
If your dataset has uneven distribution (like 95% of emails are not spam, only 5% are spam), your model might just predict “not spam” for everything and still be 95% accurate – but completely useless. EDA helps you identify and plan to fix this imbalance.
The Axe Sharpening Analogy
There’s a famous saying: “If you have six hours to chop down a tree, spend the first four hours sharpening the axe.” This means the more time you spend understanding your data in the EDA phase, the easier and more effective the model building process will be.
When you know your data thoroughly, decisions become simple. You’ll know which features are important, which algorithms might work, and what problems to watch out for. Without EDA, you’re essentially guessing.
Feature Engineering and Selection
This crucial step involves creating new, more informative features and selecting the most relevant ones for your model.
Understanding Features
“Features” are the input columns of your dataset. They’re what your model uses to make predictions. If you’re predicting house prices, features might include bedrooms, bathrooms, square footage, location, and age of the house. The quality and relevance of your features directly determine how well your model performs.
Feature Engineering: Creating Better Features
Feature engineering is the process of creating new columns from existing data to make your model’s job easier.
Why Create New Features?
Sometimes the raw data doesn’t directly represent what matters. Let me explain with examples:
Example 1: House Price Prediction
Your raw data has separate columns for “number of bedrooms” and “number of bathrooms.” But what really matters to buyers is total space. So you create a new feature: “total_rooms” = bedrooms + bathrooms. This single feature might be more informative than the two separate ones.
Example 2: E-commerce Customer Value
You have “total_purchases” and “account_age” columns. But what really indicates a valuable customer? You create “purchases_per_year” = total_purchases ÷ account_age. This new feature better represents customer value.
Example 3: Date Information
You have a “transaction_date” column. But dates alone don’t mean much. You extract:
- Day of week (Are weekends different from weekdays?)
- Month (Are there seasonal patterns?)
- Is it a holiday? (Do people shop differently on holidays?)
These new features reveal patterns the raw date couldn’t show.
The Intelligence Behind It
Good feature engineering requires understanding your problem domain. You need to think about what really matters for your prediction. A data scientist working on medical diagnoses needs medical knowledge. Someone predicting stock prices needs financial knowledge.
# Simple example of feature engineering
df['total_rooms'] = df['bedrooms'] + df['bathrooms']
df['price_per_room'] = df['price'] / df['total_rooms']
df['is_weekend'] = df['day_of_week'].isin([5, 6])
Feature Selection: Choosing the Best Features
Feature selection is choosing the most important subset of features from all available features (including the original ones and any engineered features).
Why Too Many Features Cause Problems
Imagine trying to predict if it will rain tomorrow. You could use:
- Cloud coverage (very relevant)
- Humidity (very relevant)
- Temperature (somewhat relevant)
- Wind speed (somewhat relevant)
- The color of your neighbor’s car (completely irrelevant)
- What you had for breakfast (completely irrelevant)
Including irrelevant features like car color and breakfast confuses your model. It’s like giving someone directions but including random, useless information – it makes the task harder, not easier.
Two Main Problems with Too Many Features:
1. Irrelevant Features Reduce Accuracy: Features that don’t influence the output add noise. Your model wastes time trying to find patterns that don’t exist, and might even find false patterns by random chance.
2. Longer Training Time: More features mean more calculations. A model with 100 features might take hours to train, while the same model with 10 carefully selected features might take minutes – and perform better!
How Feature Selection Works
Various techniques help identify important features:
- Statistical tests measure which features correlate with the output
- Model-based methods train a simple model and see which features it uses most
- Recursive elimination removes the least important features one by one
The goal is to keep only features that genuinely help predict the output.
Summary
Feature engineering creates better, more informative features. Feature selection chooses the best existing features. Together, they transform your raw data into a powerful set of inputs that make your model’s job much easier.
Think of it like cooking: feature engineering is creating new ingredients (like making sauce from tomatoes, garlic, and herbs), while feature selection is choosing which ingredients to include in your final dish.
Model Training, Evaluation, and Selection
Once your data is clean and your features are well-engineered, you’re ready to train your machine learning models. This is often what people think of when they hear “machine learning,” but as you can see, it comes after several crucial preparation steps.
Model Training: Teaching Your Algorithm
What Is Model Training?
Training a model means feeding it data so it can learn patterns. Imagine teaching a child to recognize animals. You show them many pictures of cats and dogs, telling them which is which. Eventually, they learn the patterns (cats have pointed ears, dogs have floppy ears) and can identify new animals they’ve never seen. Machine learning works similarly.
Why Train Multiple Algorithms?
You never know which algorithm will perform best on your specific data. Different algorithms have different strengths:
- Linear Regression: Works well for simple, straight-line relationships
- Decision Trees: Good at handling complex rules and interactions
- Random Forests: Powerful for most problems, handles non-linear patterns
- Neural Networks: Excellent for very complex patterns, especially with lots of data
It’s like trying different tools for a job. You wouldn’t use only a hammer for all carpentry work – sometimes you need a saw, screwdriver, or drill. Similarly, you train multiple algorithms and see which works best for your data.
Experienced practitioners often train 5-10 different algorithms, even from completely different families, to find the best performer.
Model Evaluation: Measuring Performance
After training models, you need to know how well they perform. This is like grading a student’s exam – you need objective measures of success.
Common Performance Metrics
For Classification (predicting categories):
- Accuracy: What percentage of predictions were correct? Simple but can be misleading with imbalanced data.
- Precision: Of all the positive predictions, how many were actually correct? Important when false positives are costly (like spam detection).
- Recall: Of all actual positives, how many did we catch? Important when false negatives are costly (like disease detection).
- F1-Score: Balances precision and recall into one number.
For Regression (predicting numbers):
- Mean Squared Error (MSE): Average of squared differences between predictions and actual values. Lower is better.
- Mean Absolute Error (MAE): Average of absolute differences. Easier to interpret than MSE.
Why Multiple Metrics Matter
A single metric rarely tells the whole story. Imagine a disease detection model that’s 99% accurate – sounds great! But if only 1% of people have the disease, a model that always predicts “no disease” would also be 99% accurate while being completely useless.
You need multiple metrics to understand how your model really performs in different situations.
Model Selection: Choosing the Best
After evaluating all models, you select the best one based on your metrics. But there’s more work to do.
Hyperparameter Tuning
Every machine learning algorithm has settings called “hyperparameters” – like knobs and switches you can adjust. Think of it like adjusting your TV:
- Brightness
- Contrast
- Color saturation
- Sharpness
Just as adjusting these settings can make your TV picture look better, tuning hyperparameters improves your model’s performance. For example, a Random Forest has settings like:
- How many trees to use?
- How deep should each tree be?
- How many features to consider at each split?
You systematically try different combinations to find the best settings. This can improve your model’s accuracy by several percentage points.
Ensemble Learning: Combining Models
Sometimes, combining multiple models creates a more powerful result than any single model. This is called ensemble learning.
Think of it like asking for advice. One person might give you a biased opinion. But if you ask ten people and take the majority opinion, you’re more likely to get a good answer. Ensemble methods work similarly:
- Bagging: Train multiple models on different subsets of data and average their predictions
- Boosting: Train models sequentially, each one focusing on correcting the previous model’s mistakes
- Stacking: Train multiple models, then train another model to combine their predictions optimally
Ensemble methods often win machine learning competitions because they’re so powerful.
The Goal
The goal of this stage is to identify, refine, and select the most powerful and effective machine learning model that will be used for deployment. You want a model that not only performs well on your test data but will also work well in the real world.
Model Deployment
Once you have a powerful model, the next step is making it available to users. This is called deployment, and it’s where your machine learning project becomes a real product.
Why Deployment Matters
Building and training a model is not the end – it’s just the beginning. Imagine spending months developing a revolutionary new medicine, then keeping it locked in a laboratory. It helps no one. Similarly, a machine learning model sitting on your computer helps no one. You need to deploy it so people can actually use it.
The Reality Gap
There’s a big difference between a model running on your laptop and a model serving millions of users. When deployed, your model needs to:
- Handle thousands of requests per second
- Respond quickly (users won’t wait 30 seconds for a prediction)
- Stay running 24/7 without crashing
- Handle unexpected inputs gracefully
- Update without disrupting service
Product Formats
Your deployed model can take various forms:
Website: Users interact through a web application. For example, a loan approval system where customers enter their information and instantly see if they’re approved.
Mobile App: The model is integrated into a mobile application. Think of photo editing apps that use AI to enhance images, or translation apps that work in real-time.
Desktop Application: The model runs within desktop software. For example, grammar checking software or video editing tools with AI features.
API Service: Other software systems can request predictions. For example, a fraud detection model that other banking systems can query.
How Deployment Works
The basic flow is:
- Save Your Trained Model: You save your model as a file that can be loaded later. Think of it like saving a document – you’re preserving all the patterns your model learned.
- Create an API: An API (Application Programming Interface) acts as a middleman. It receives requests, passes them to your model, gets predictions, and sends them back. It’s like a receptionist who takes messages and delivers responses.
- Host on Servers: Your model runs on powerful computers (servers) in data centers. These servers are always on, connected to the internet, and can handle many requests simultaneously.
- User Interaction: When a user interacts with your website or app, their input is sent to your server, your model makes a prediction, and the result is sent back and displayed to the user – all in seconds.
Cloud Platforms
Most models are deployed on cloud platforms like:
- AWS (Amazon Web Services): The most popular, with extensive machine learning services
- Google Cloud Platform: Strong AI/ML tools and integration
- Microsoft Azure: Good for enterprises already using Microsoft products
These platforms handle the heavy lifting of server management, scaling, and reliability, letting you focus on your model.
The Goal
Make your machine learning model accessible and usable by end-users through a functional application. Transform your model from a research project into a real product that delivers value.
Beta Testing
After deployment, your model needs testing in a real-world environment before full public release. This is where beta testing comes in.
Why Beta Testing Is Critical
Imagine a car manufacturer releasing a new model without any test drives. The car might look perfect in the factory, but on real roads with real drivers, problems emerge: the brakes squeak, the air conditioning fails, or the GPS gives wrong directions.
Similarly, your machine learning model might perform perfectly on test data, but in the real world with real users, unexpected issues arise:
- Users input data in formats you didn’t anticipate
- Real-world data has patterns your training data didn’t capture
- The model performs differently under heavy load
- Users interact with the interface in unexpected ways
Beta testing catches these issues before they affect all your users.
How Beta Testing Works
Phased Rollout
Instead of releasing to everyone at once, you release to a small group first. Typically:
- Start with 1-5% of users
- If it works well, expand to 10-25%
- If still successful, expand to 50%
- Finally, release to everyone
Target Users
You usually choose:
- Loyal customers who won’t abandon you if something goes wrong
- Tech-savvy users who can provide detailed feedback
- Internal company employees who can test thoroughly
- Volunteers who signed up specifically to test new features
A/B Testing
Show the new model to some users (Group A) and the old model to others (Group B). Compare performance. This tells you if the new model is actually better or if it’s causing problems.
Gathering Feedback
During beta testing, you collect:
- Performance metrics: How accurate are predictions? How fast is the system?
- User feedback: Are users satisfied? Do they find it useful?
- Error logs: What’s breaking? Where are the problems?
- Usage patterns: How are people actually using it?
Decision Point
After analyzing beta test results, you have two paths:
Success Path: If everything works well and feedback is positive, proceed to full launch. Congratulations!
Issues Path: If there are problems, you go back to earlier MLDLC steps:
- Bad predictions? Return to Feature Engineering or Model Training
- Data quality issues? Return to Data Pre-processing or Data Gathering
- Technical problems? Fix the deployment infrastructure
- User confusion? Improve the user interface
The Iterative Nature
MLDLC is a cycle, not a straight line. Beta testing often reveals issues that require you to iterate back through earlier stages. This is normal and expected. Each iteration makes your product better.
Think of it like writing an essay. You write a draft, have someone read it, get feedback, and revise. You might go through several drafts before you have something great. Beta testing is like getting feedback on your draft.
Optimizing the Model
This final stage involves continuously refining and improving your deployed model to ensure efficiency and sustained performance. This is ongoing work that continues as long as your model is in production.
Why Optimization Never Ends
Once your model is live, your work isn’t finished. The real world changes constantly:
- New patterns emerge in the data
- User behavior evolves
- Competitors launch new features
- Technology advances
- Business requirements change
Your model needs continuous optimization to stay relevant and effective.
Key Optimization Areas
Backup and Disaster Recovery
Imagine your production model suddenly fails, and you don’t have a backup. Your entire service goes down. Customers can’t use your product. Your company loses money every minute.
Why backups matter:
- Hardware can fail
- Software updates can introduce bugs
- Cyber attacks can compromise systems
- Human errors happen
You need regular backups of both your model and your data. If something breaks, you can quickly restore a previous working version. This is called a “rollback” – like hitting undo after making a mistake.
Load Balancing
What happens when thousands of users want predictions at the same time? If one server handles all requests, it gets overwhelmed and becomes slow or crashes.
Load balancing distributes requests across multiple servers. Think of it like checkout lanes at a supermarket. If there’s only one lane open, lines get very long. But with ten lanes open, customers move through quickly. Load balancing does this automatically for your model.
Model Retraining and Drift Detection
This is one of the most important aspects of optimization.
What is Model Drift?
Your model was trained on historical data. But the real world changes. Patterns that were true six months ago might not be true today. When your model’s accuracy decreases because the world has changed, that’s called “drift.”
Example: Imagine a mask detection system trained in 2020 on standard cloth masks. By 2023, people started using:
- Transparent masks
- KN95 respirators
- Designer masks with patterns
The model starts failing because it never saw these new types during training. The data has “drifted” from what the model knows.
Another Example: A movie recommendation system trained on 2019 data wouldn’t know about pandemic-era viewing habits, new streaming services, or current popular genres.
How to Handle Drift
You need to retrain your model regularly with fresh data. But how often?
- Daily: For rapidly changing domains (stock prices, news trends)
- Weekly: For moderately dynamic areas (e-commerce, social media)
- Monthly: For slower-changing fields (customer churn, loan defaults)
- Quarterly: For stable domains (medical diagnoses, credit scoring)
Critical Requirement: This retraining must be automated. You cannot manually retrain every week. Set up systems that automatically:
- Collect new data
- Retrain the model
- Test the new model
- Deploy if it performs better
- Rollback if it performs worse
Performance Monitoring
Continuously monitor your model:
- Prediction accuracy: Is it staying accurate?
- Response time: Is it answering quickly?
- Error rate: How often does it fail?
- Resource usage: Is it using too much memory or CPU?
Set up alerts. If accuracy drops below a threshold, you get notified immediately. If response time becomes too slow, you’re warned. Don’t wait for users to complain.
Cost Optimization
Running machine learning models costs money:
- Server costs (computing power)
- Storage costs (data warehouses)
- Network costs (data transfer)
- Energy costs (electricity for servers)
Identify inefficiencies:
- Are you running expensive servers when cheaper ones would work?
- Are you storing unnecessary data?
- Can you optimize your code to use less computing power?
- Can you batch requests instead of processing them individually?
Small optimizations can save thousands of dollars per month for large-scale systems.
The Complete Picture
Optimization isn’t a one-time task. It’s an ongoing process of:
- Monitoring performance
- Identifying issues
- Making improvements
- Testing changes
- Repeating continuously
Think of it like maintaining a car. You don’t just buy a car and drive it forever without maintenance. You regularly change the oil, check tire pressure, fix problems as they arise, and occasionally upgrade parts. Your machine learning system needs the same continuous care.
The Ultimate Goal
Maintain high model performance, ensure system reliability, manage costs efficiently, and keep the model relevant and accurate as the real world evolves. A well-optimized system provides consistent value to users year after year.
Conclusion
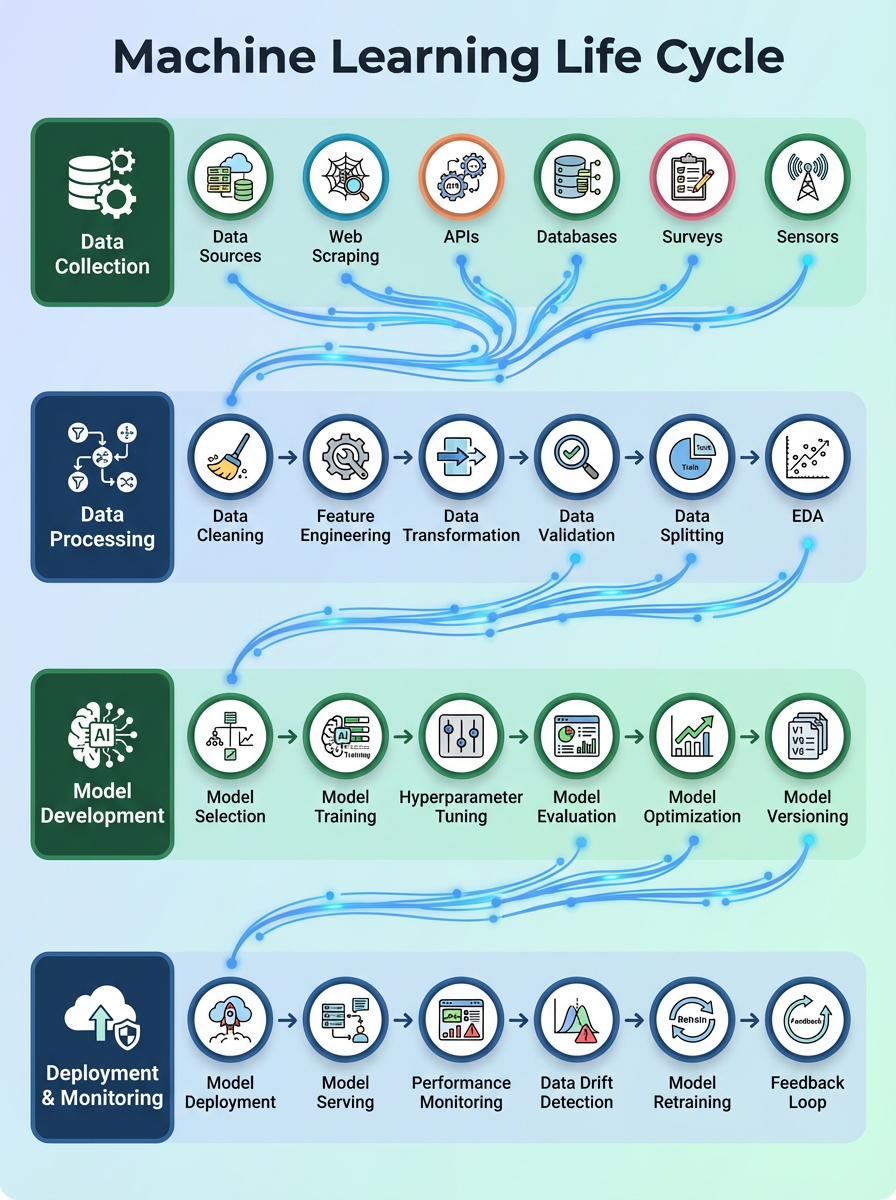
These nine steps form the complete Machine Learning Development Life Cycle:
- Framing the Problem – Define objectives, understand requirements, plan your approach
- Gathering the Data – Collect data from various sources in usable formats
- Data Pre-Processing – Clean, fix, and prepare data for analysis
- Exploratory Data Analysis – Understand patterns, relationships, and characteristics
- Feature Engineering and Selection – Create informative features and choose the best ones
- Model Training, Evaluation, and Selection – Build, test, and select optimal models
- Model Deployment – Make models accessible to real users through applications
- Beta Testing – Test with real users, gather feedback, fix issues
- Optimizing the Model – Maintain, monitor, and continuously improve the system
The Big Picture
Understanding these steps is essential for building successful, end-to-end machine learning products. Each step builds upon the previous ones, creating a complete workflow from idea to production.
Remember: Machine learning is not just about training a model and achieving good accuracy. That’s only one step in a much larger process. Real-world machine learning involves:
- Understanding business problems
- Managing data pipelines
- Engineering features
- Selecting and tuning models
- Deploying to production
- Maintaining systems
- Continuously improving
Companies don’t hire people who can just train models. They hire people who understand the entire lifecycle and can build complete, maintainable systems that deliver real value to users.
Master the MLDLC, and you’ll be well-equipped to build professional machine learning solutions that actually work in the real world.